The raw data has been obtained from https://www.kaggle.com/harlfoxem/housesalesprediction. The data are cleaned and aggregated to the census tract level for King county, WA to make it smaller in size and manageable for the workshop.
Study area and aggregation
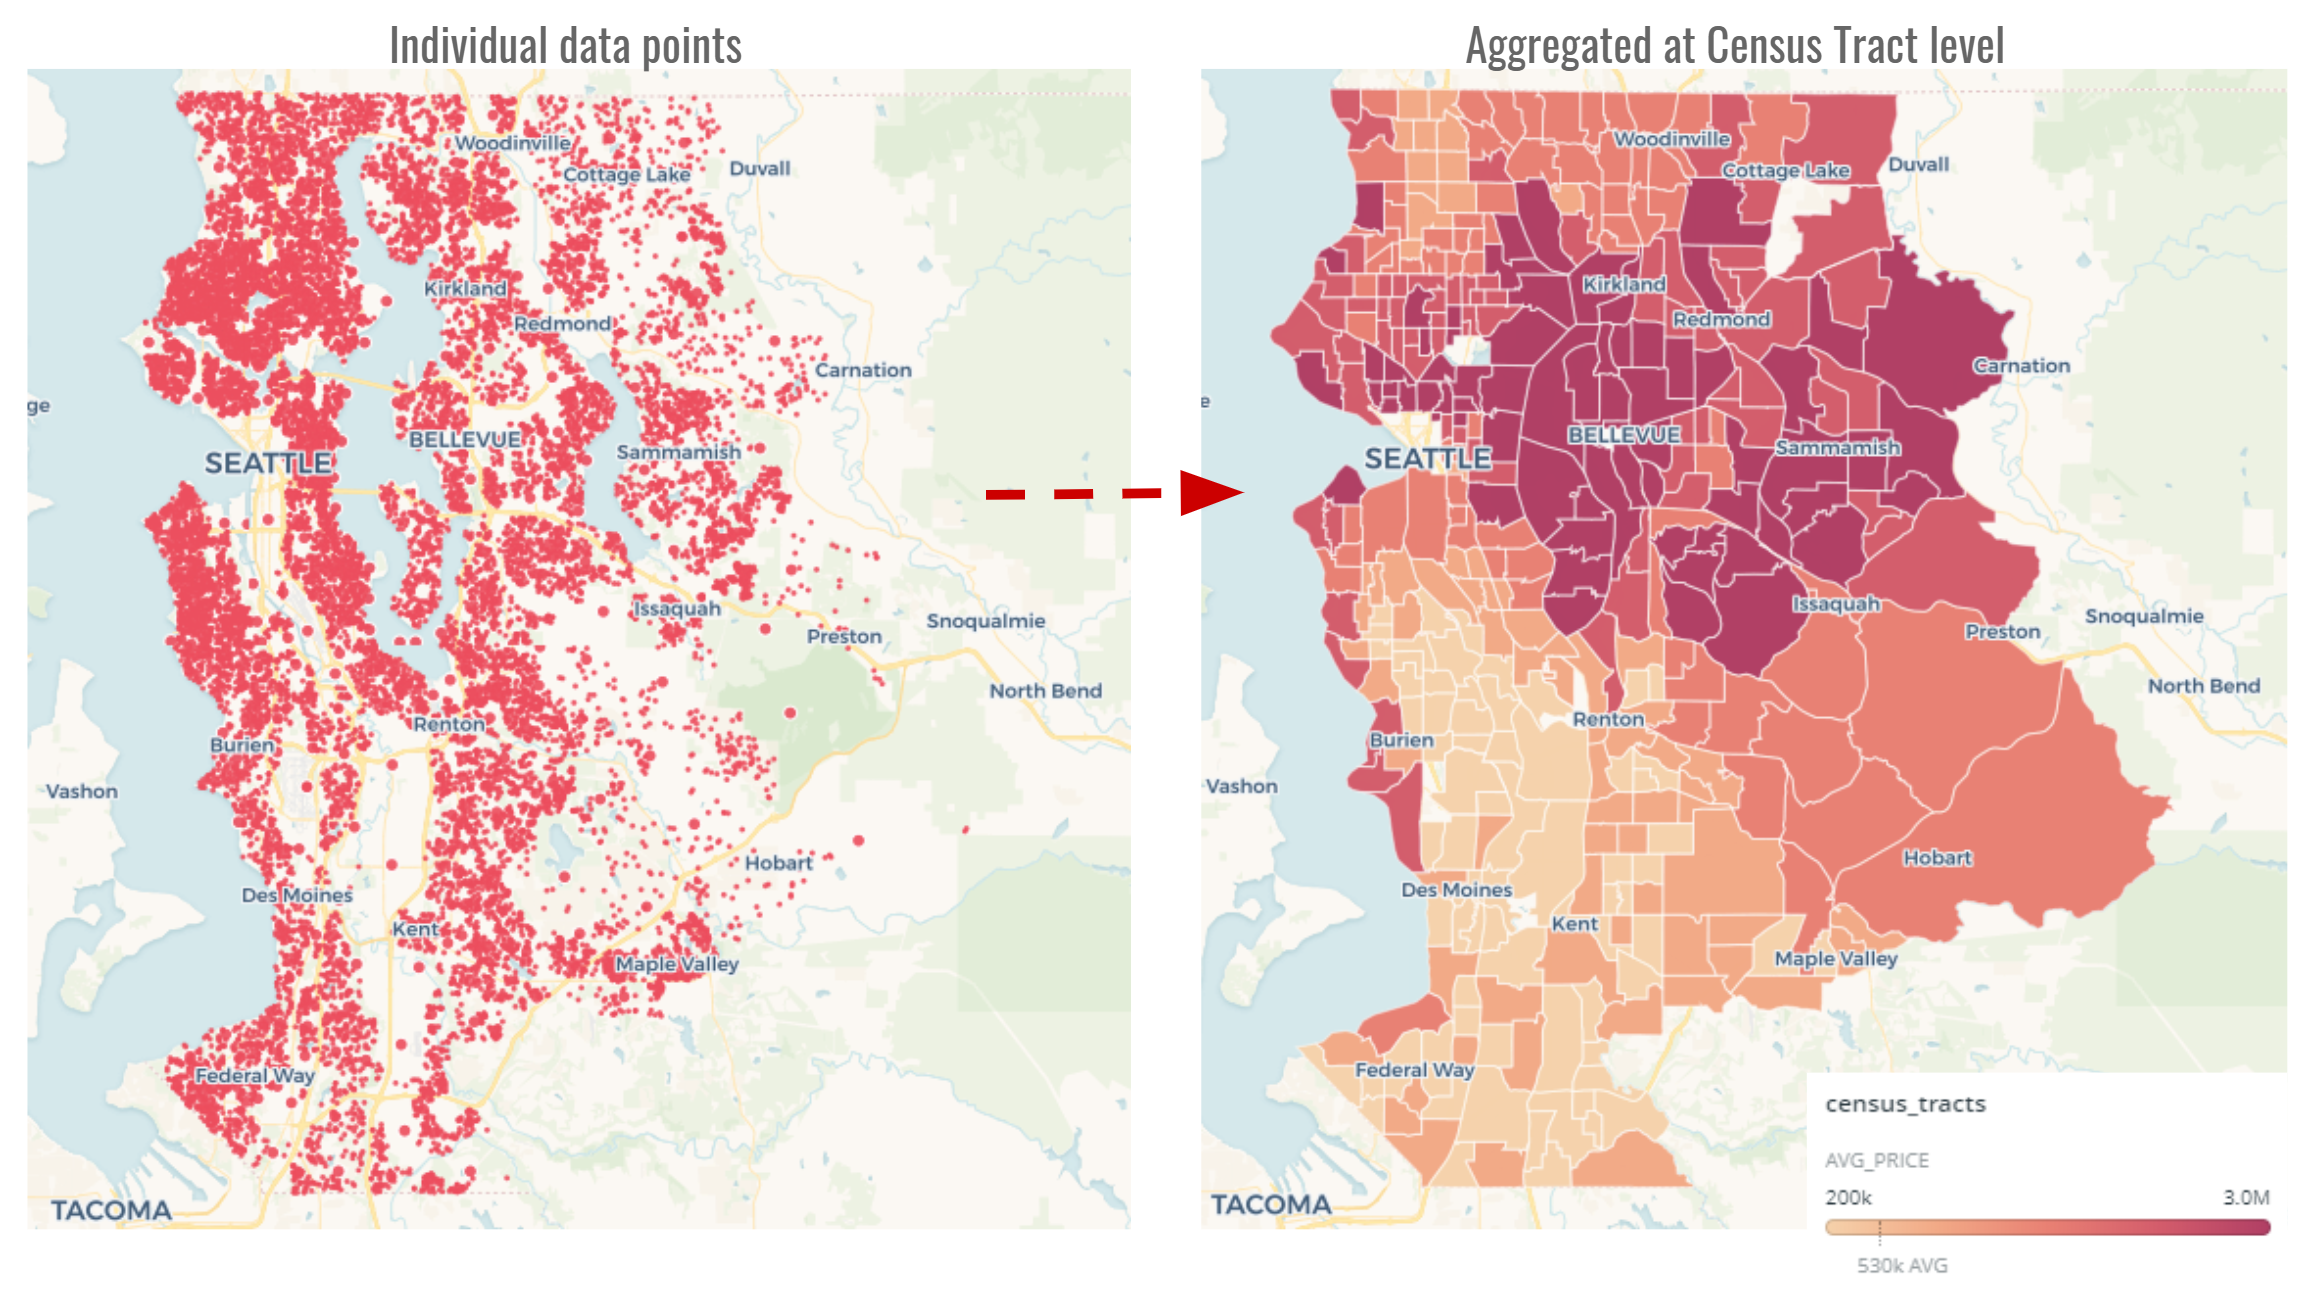
Aggregated dataset snapshot
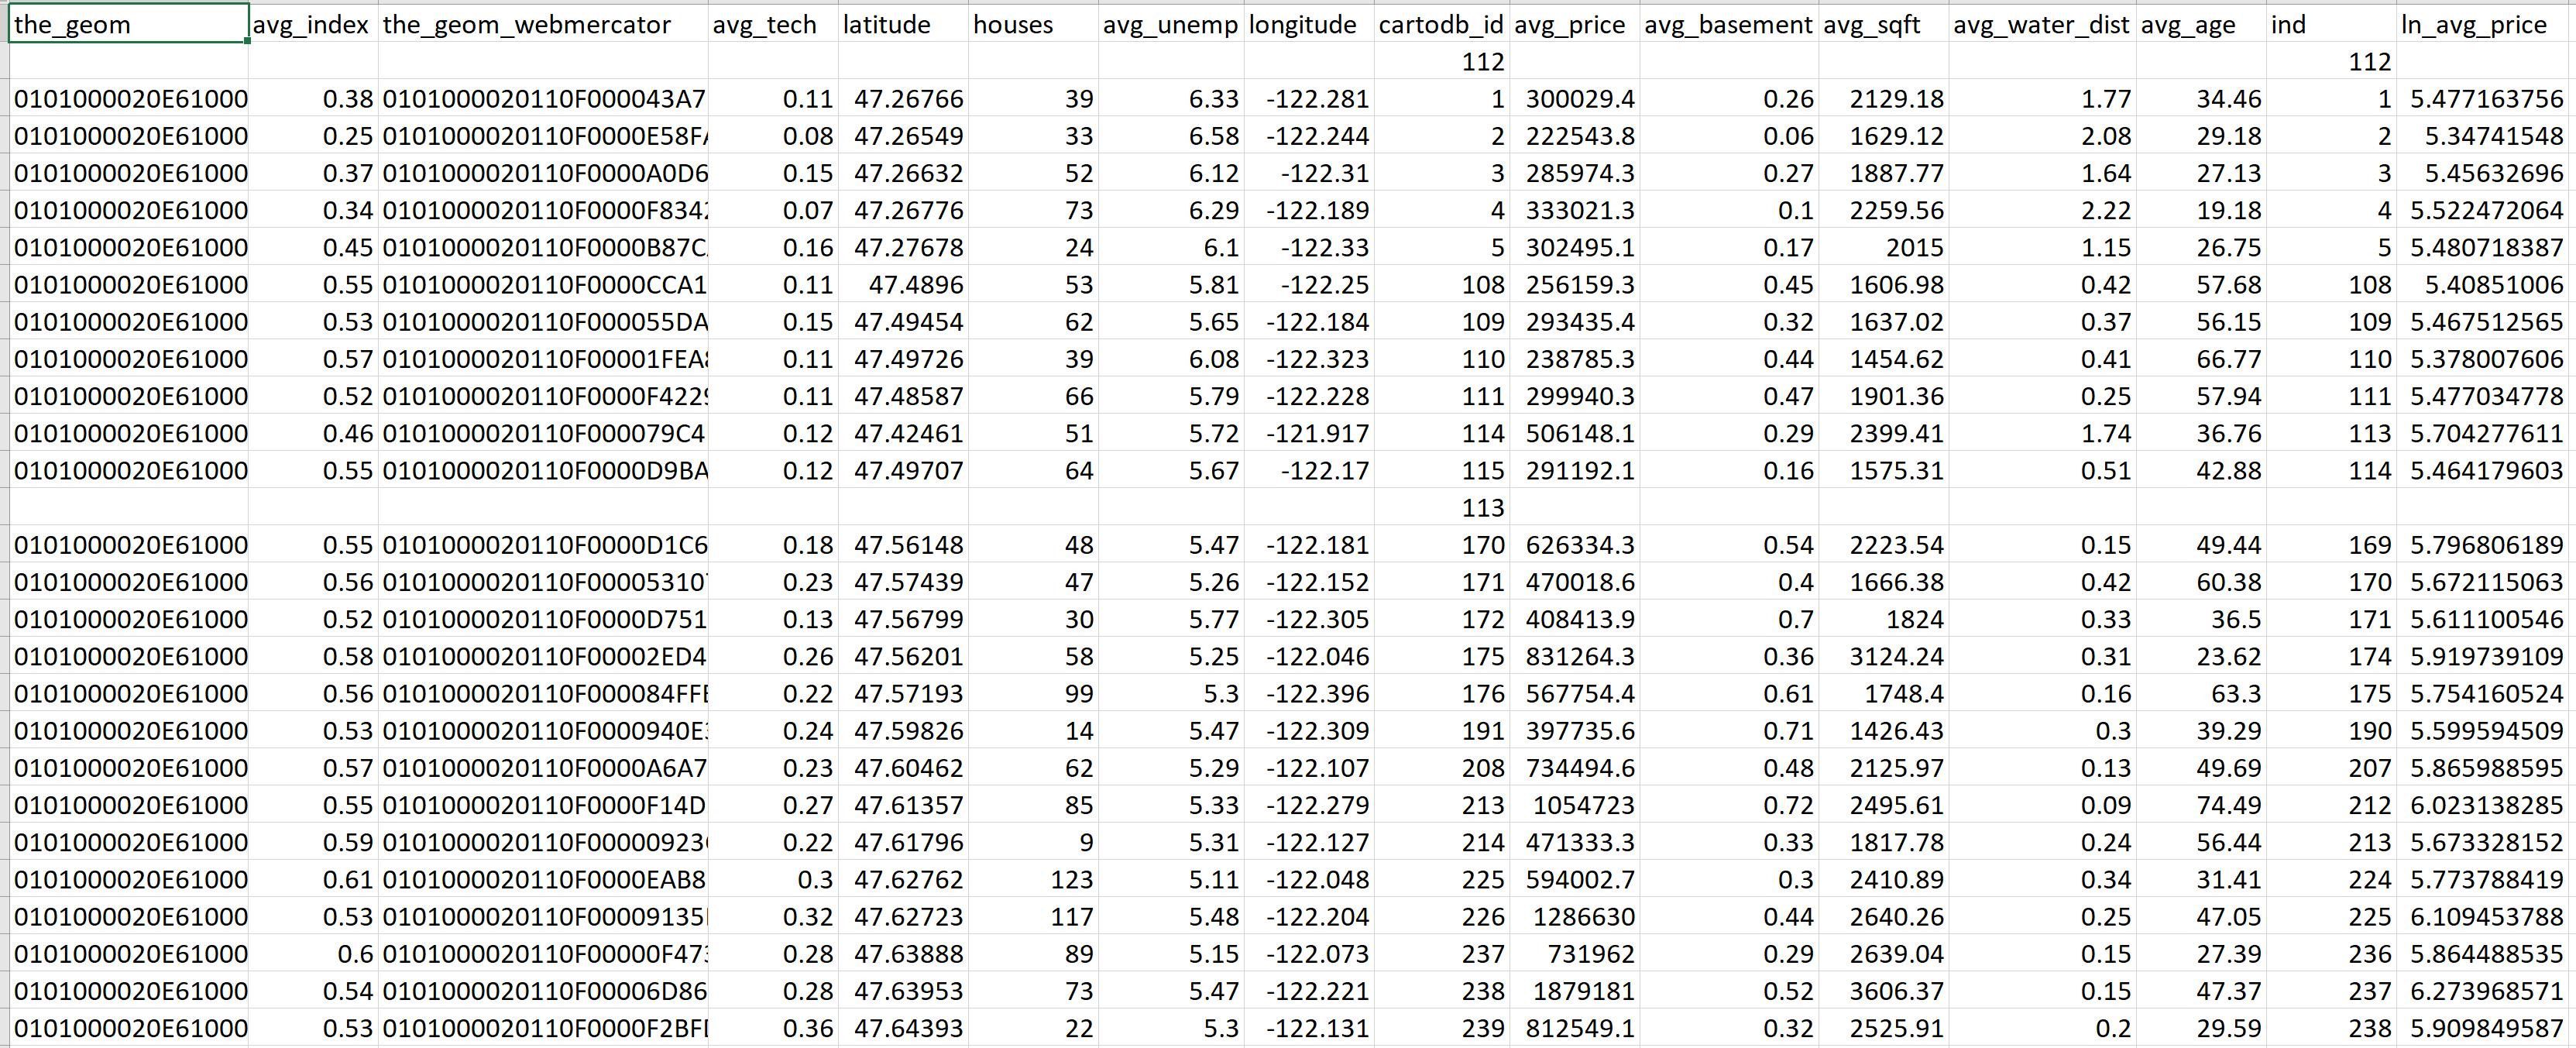
- houses - number of houses in the census tracts
Dependent variables
avg_price - average house prices in the census tracts
ORln_avg_price - log-transformed average house prices in the census tracts
Independent variables
avg_tech - average technology related jobs in the census tracts
avg_unemp - average unemployment rate in the census tracts
avg_index - average number of house with a view to the waterfront
avg_basement - average basements in the houses in the census tracts
avg_water_dist - average distance to nearest waterfronts from the houses in the census tracts
avg_sqft - average square footage of living area in houses in the census tracts
avg_age - average age of housing units in the census tracts
Dependent variable distribution
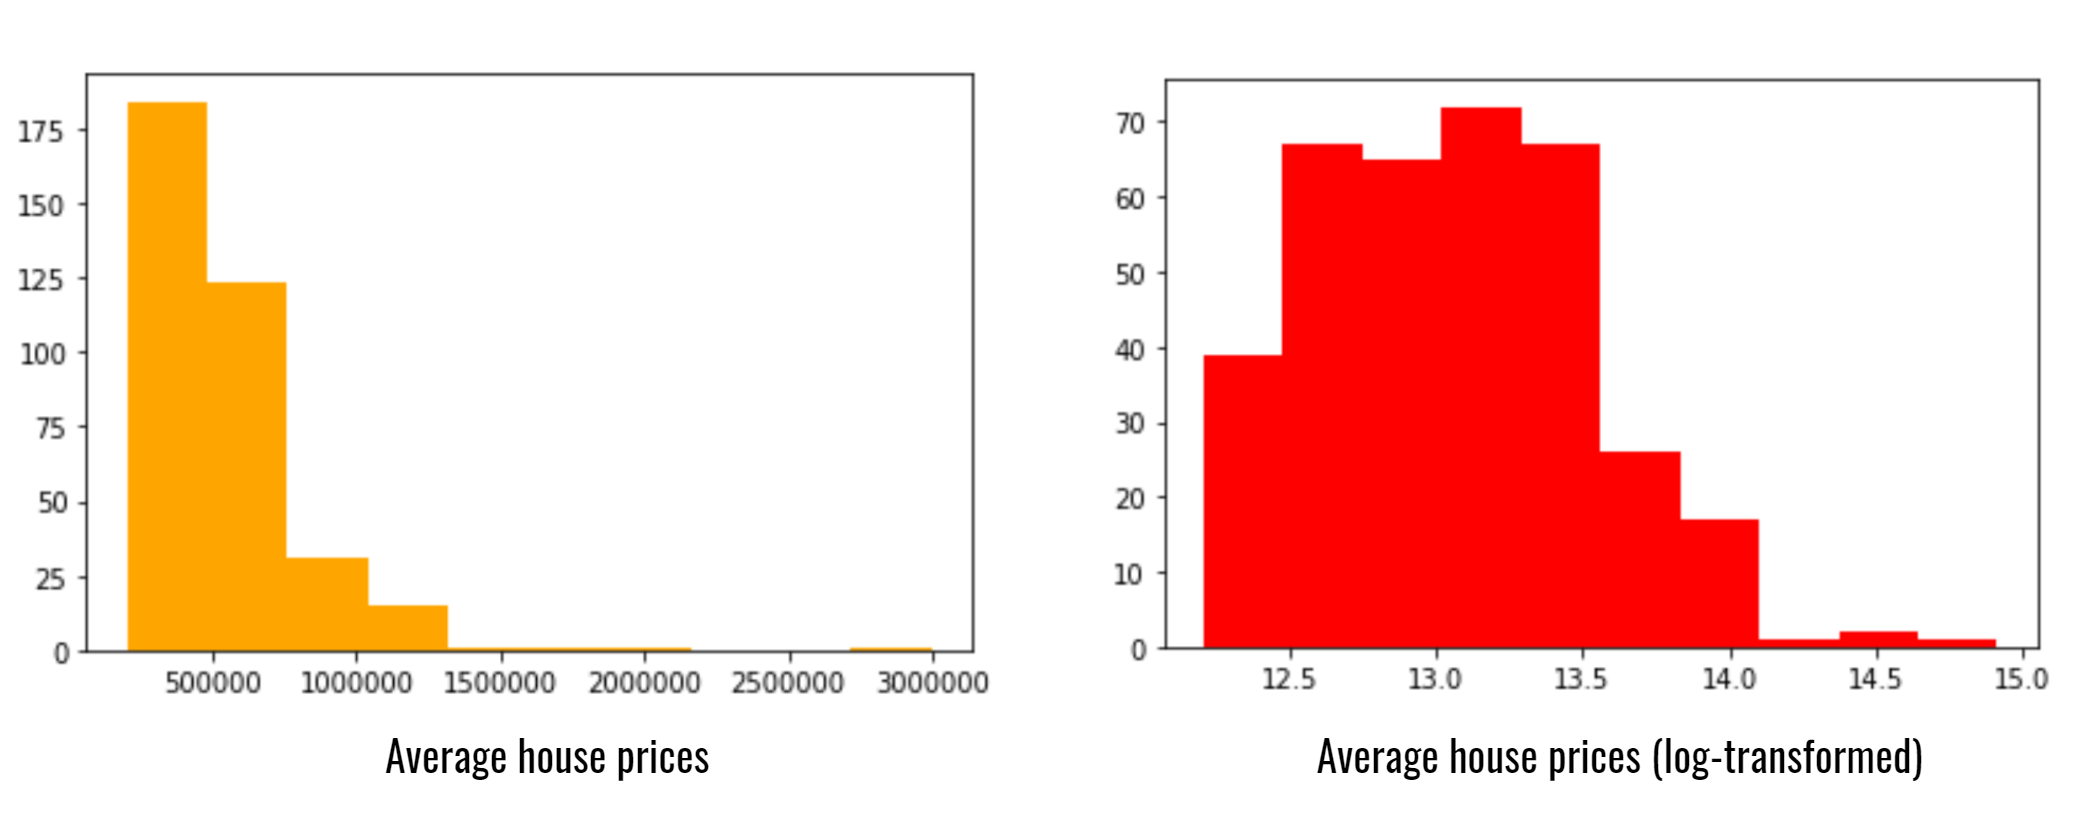
Hence, we use the log-transformed dependent variable ln_avg_price
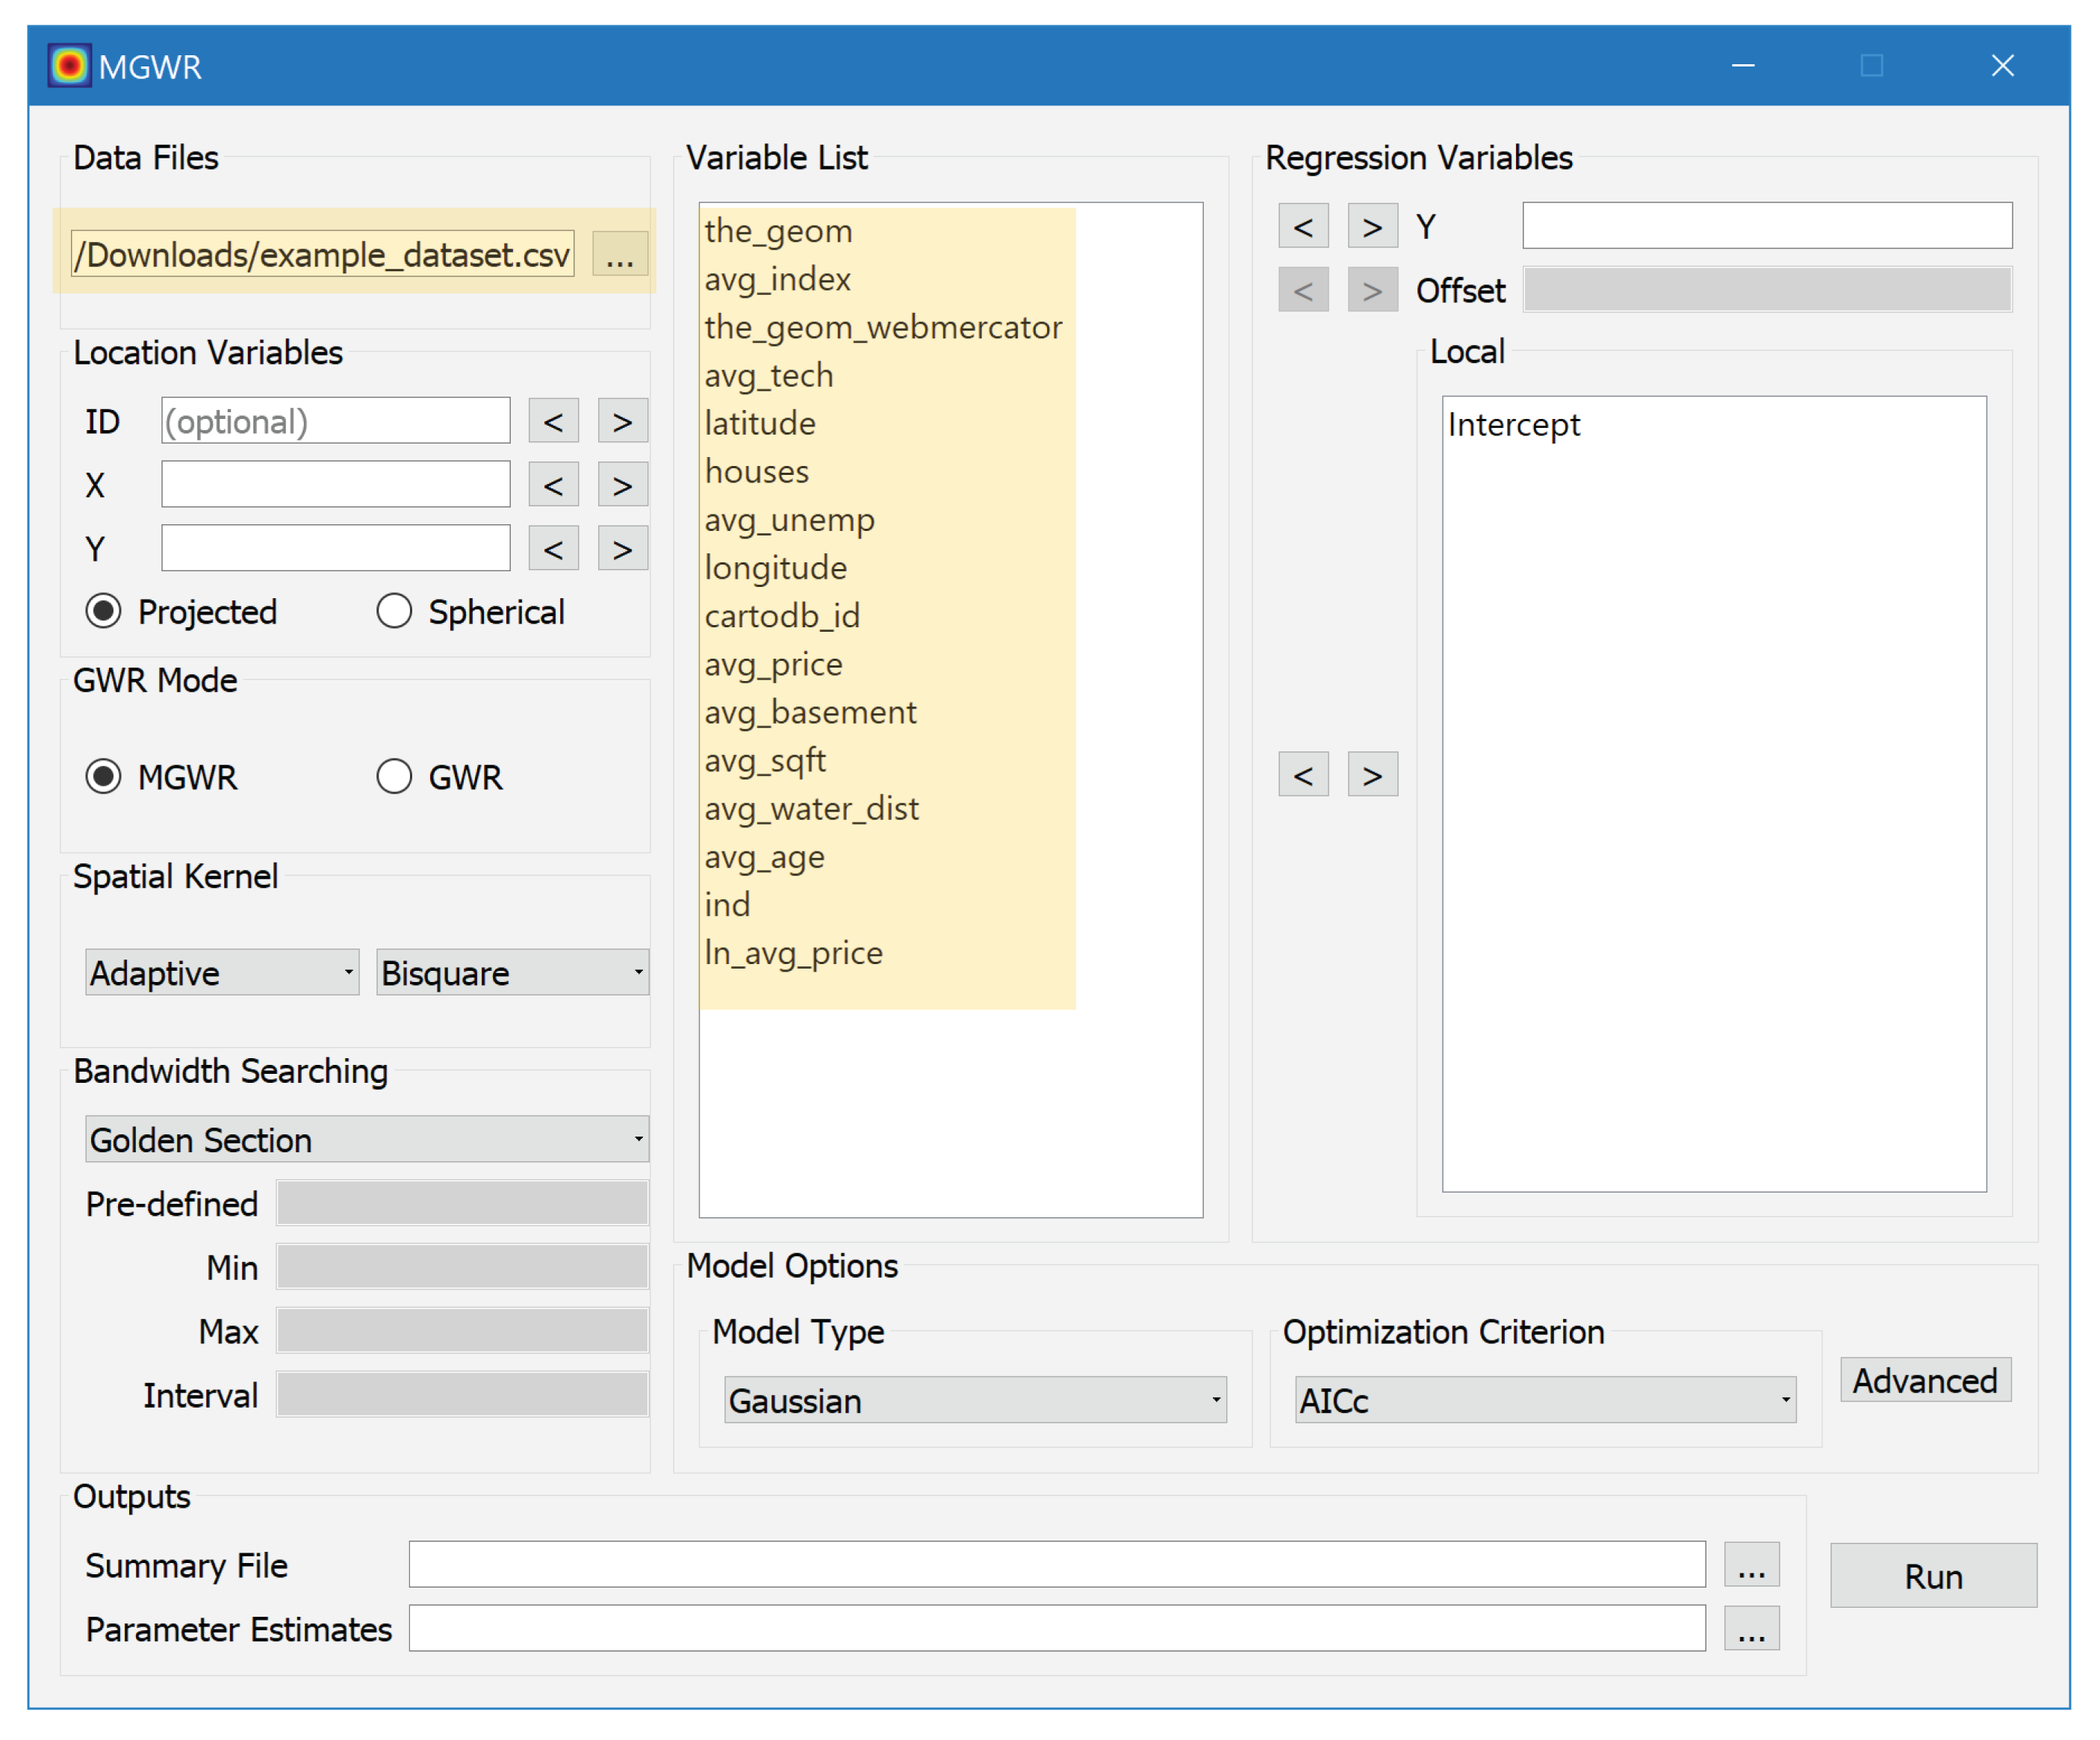
Loading the Dataset
Open the MGWR GUI software on your desktop to follow along!
At this stage I am going to do the steps elaborated below live. The screenshots of the steps below will guide you if you need additional reference.
Please note, the screenshots below are taken on a Windows system. If you are using the software on Mac, the interface might differ slightly.
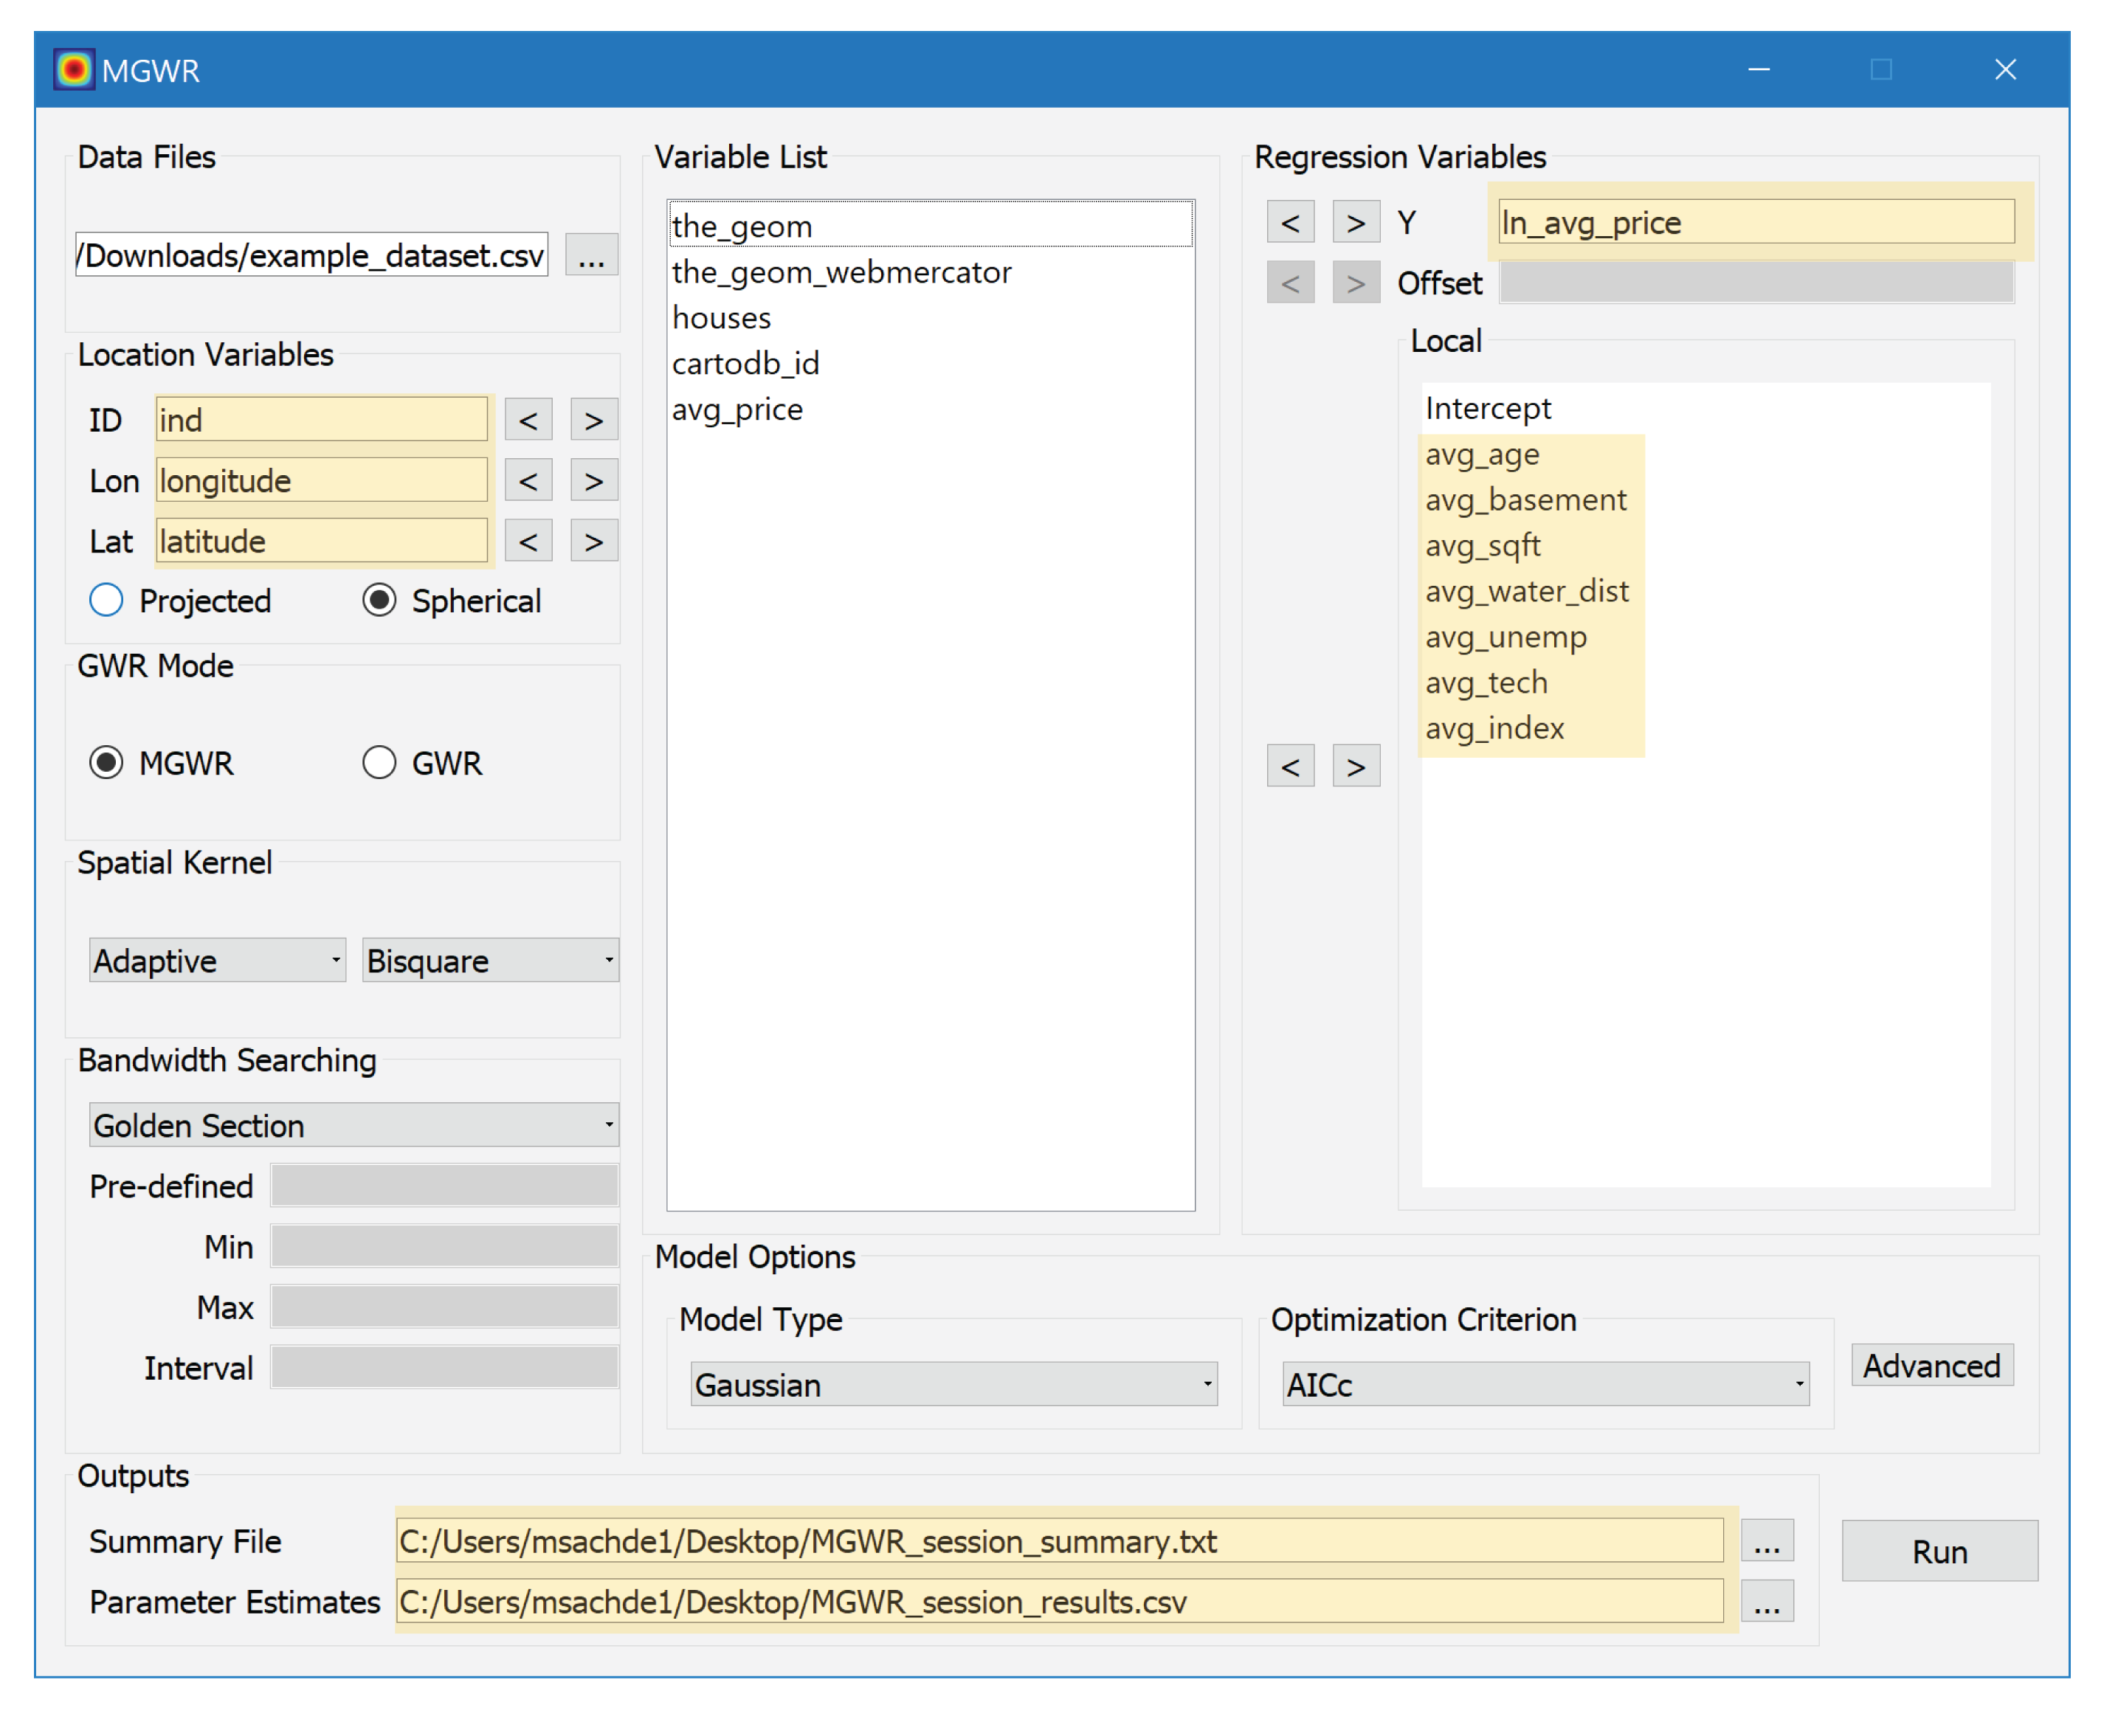
1. Loading the dataset and variables
2. Load the dependent and independent variables
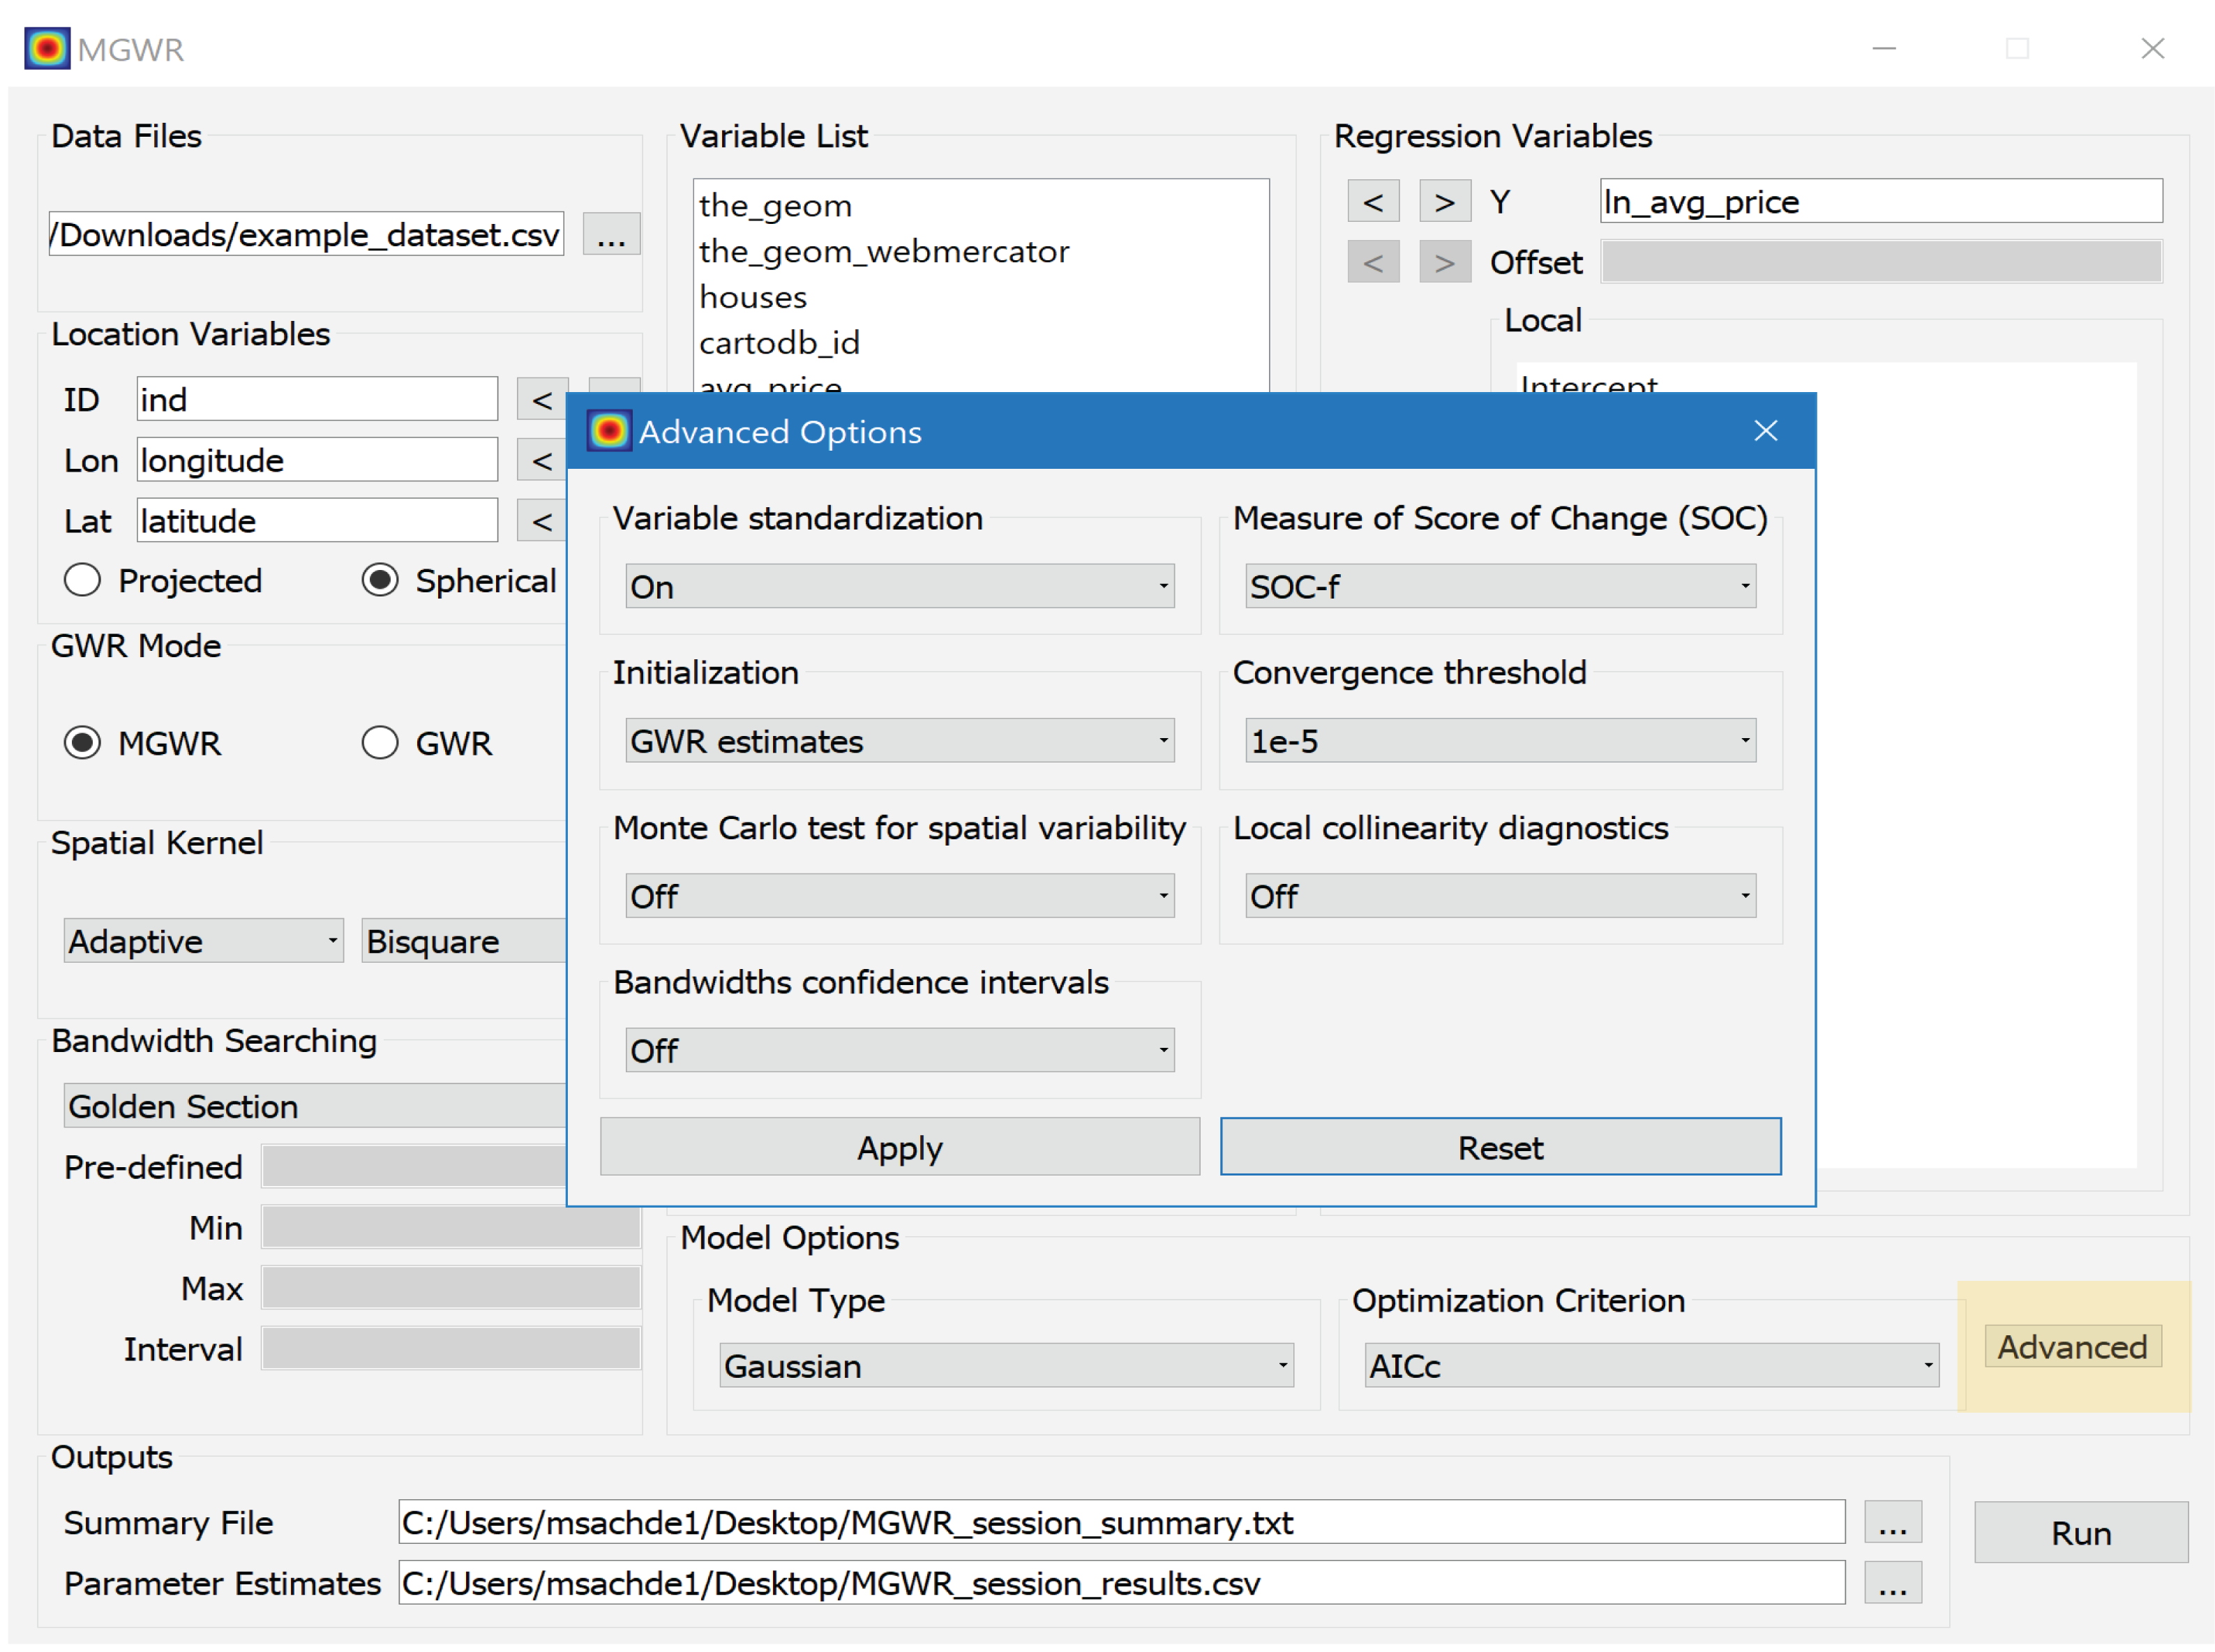
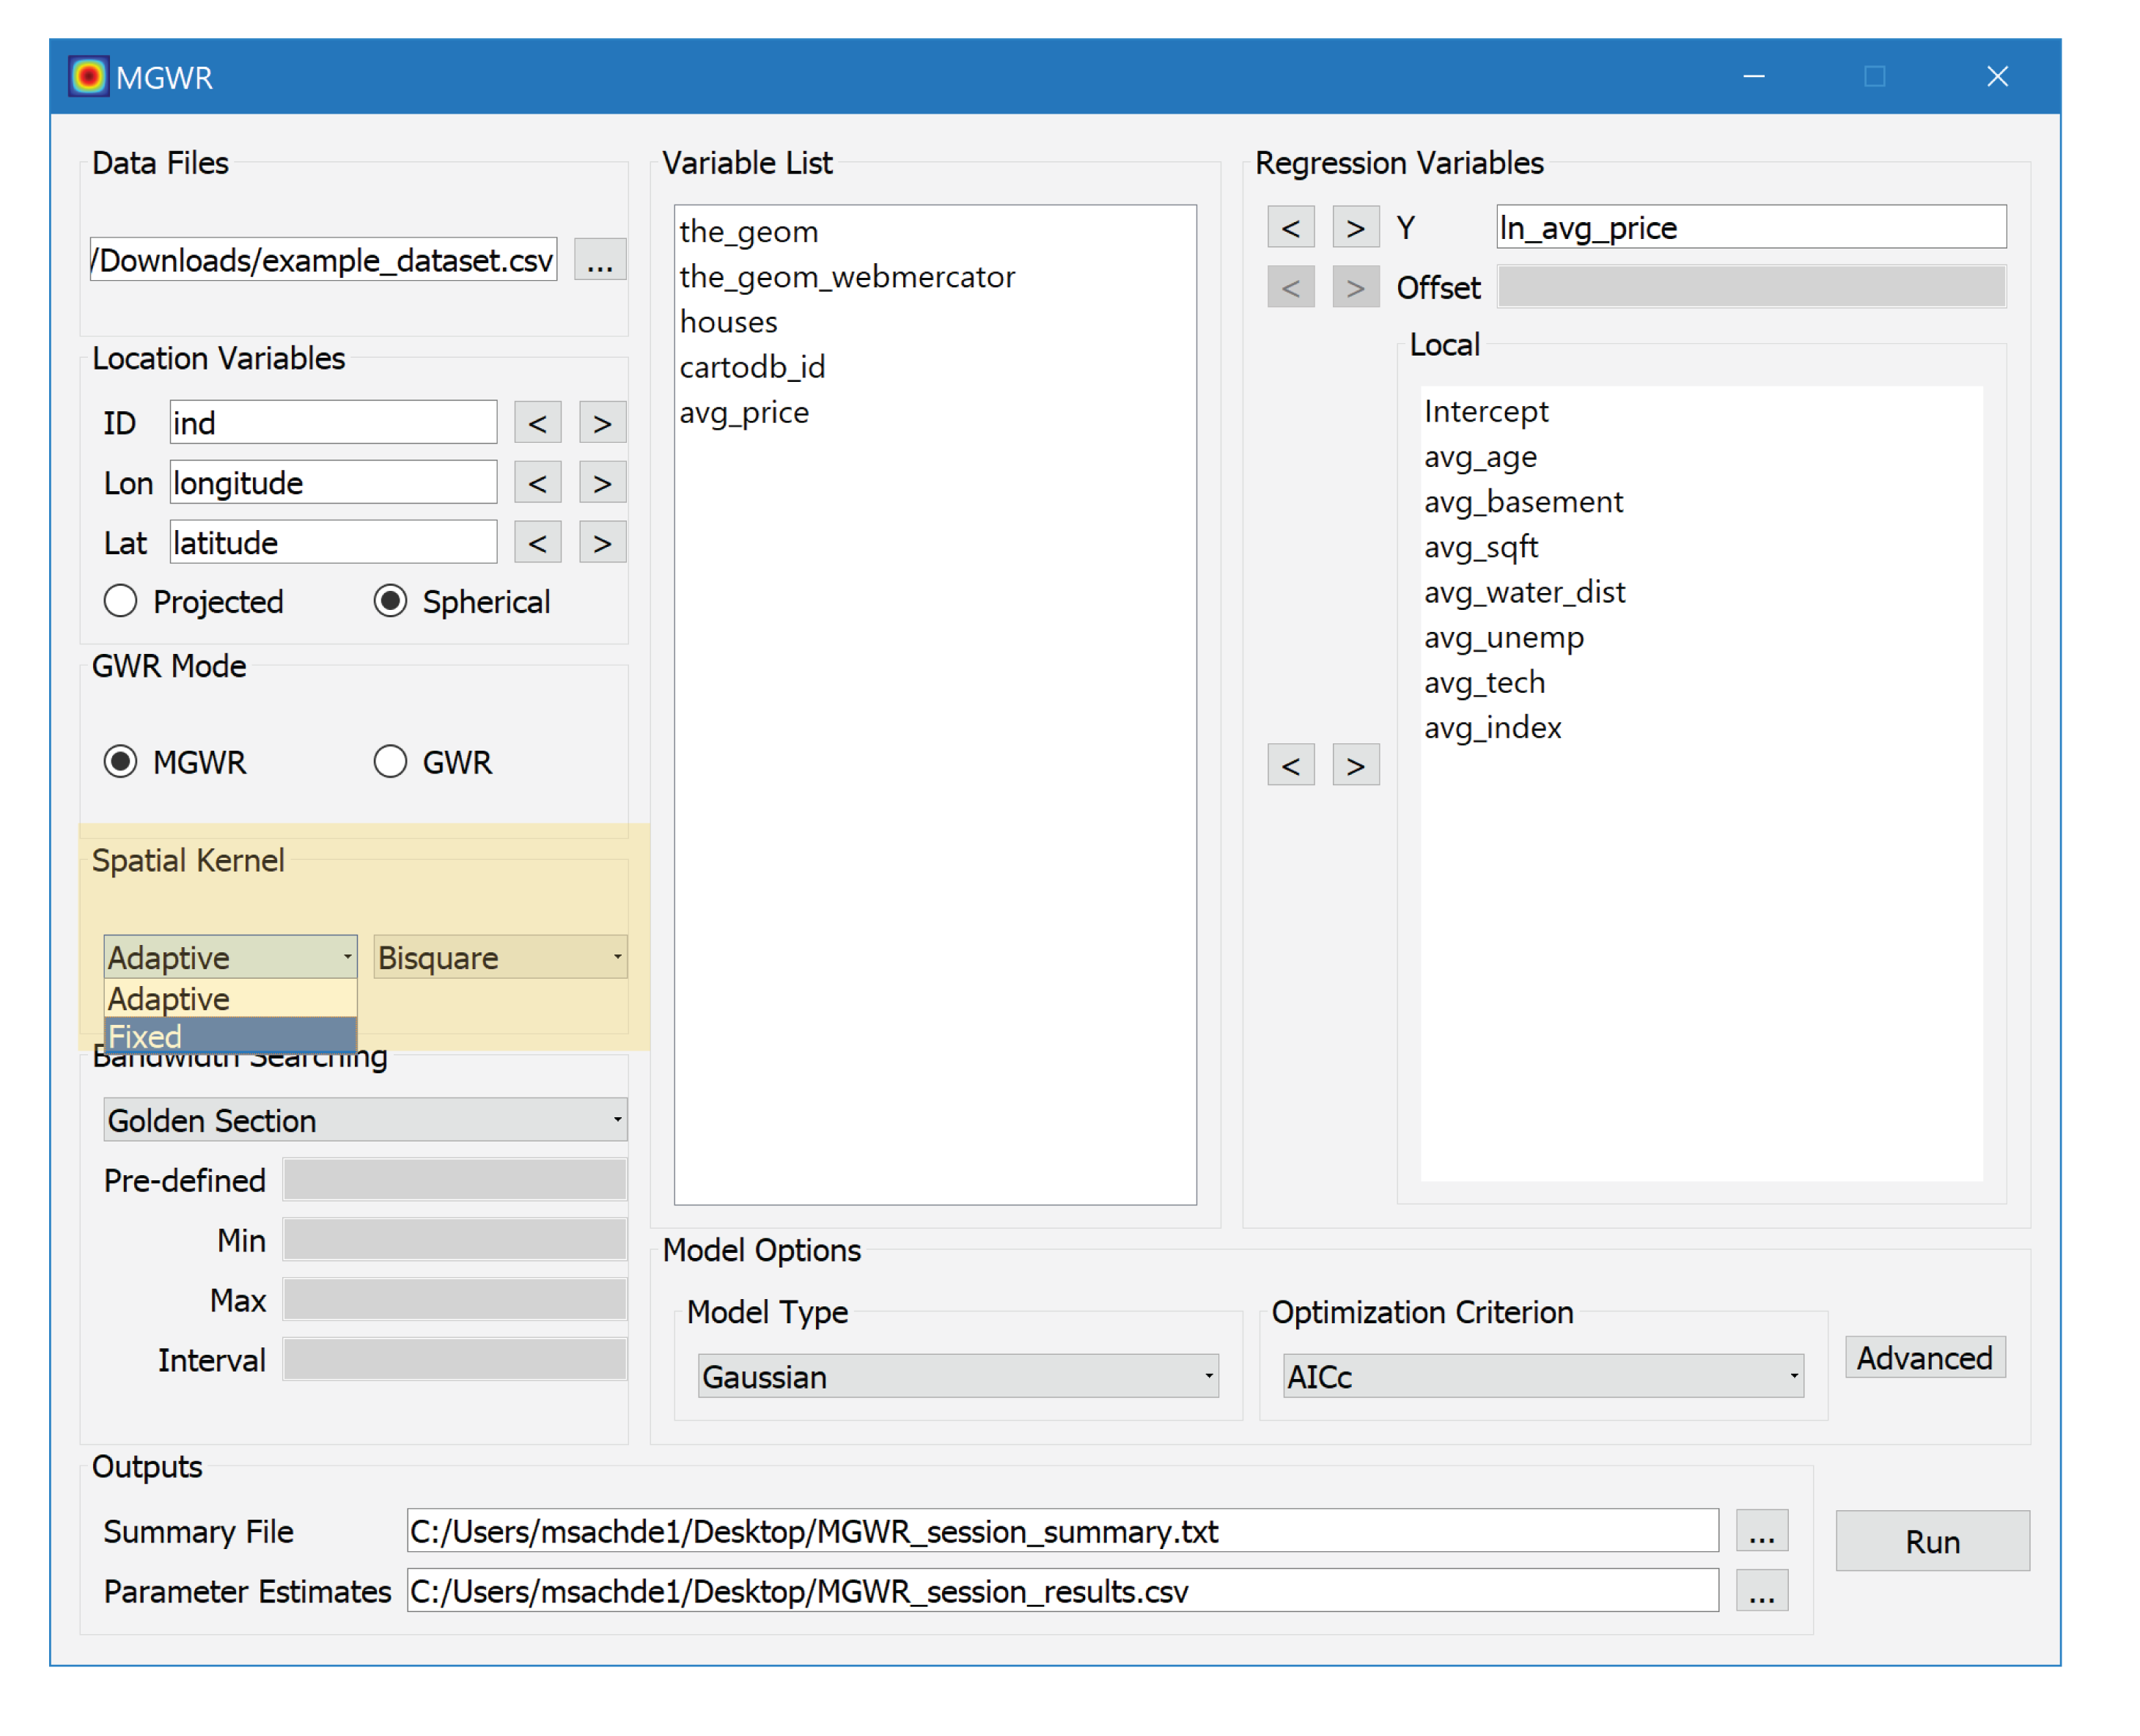
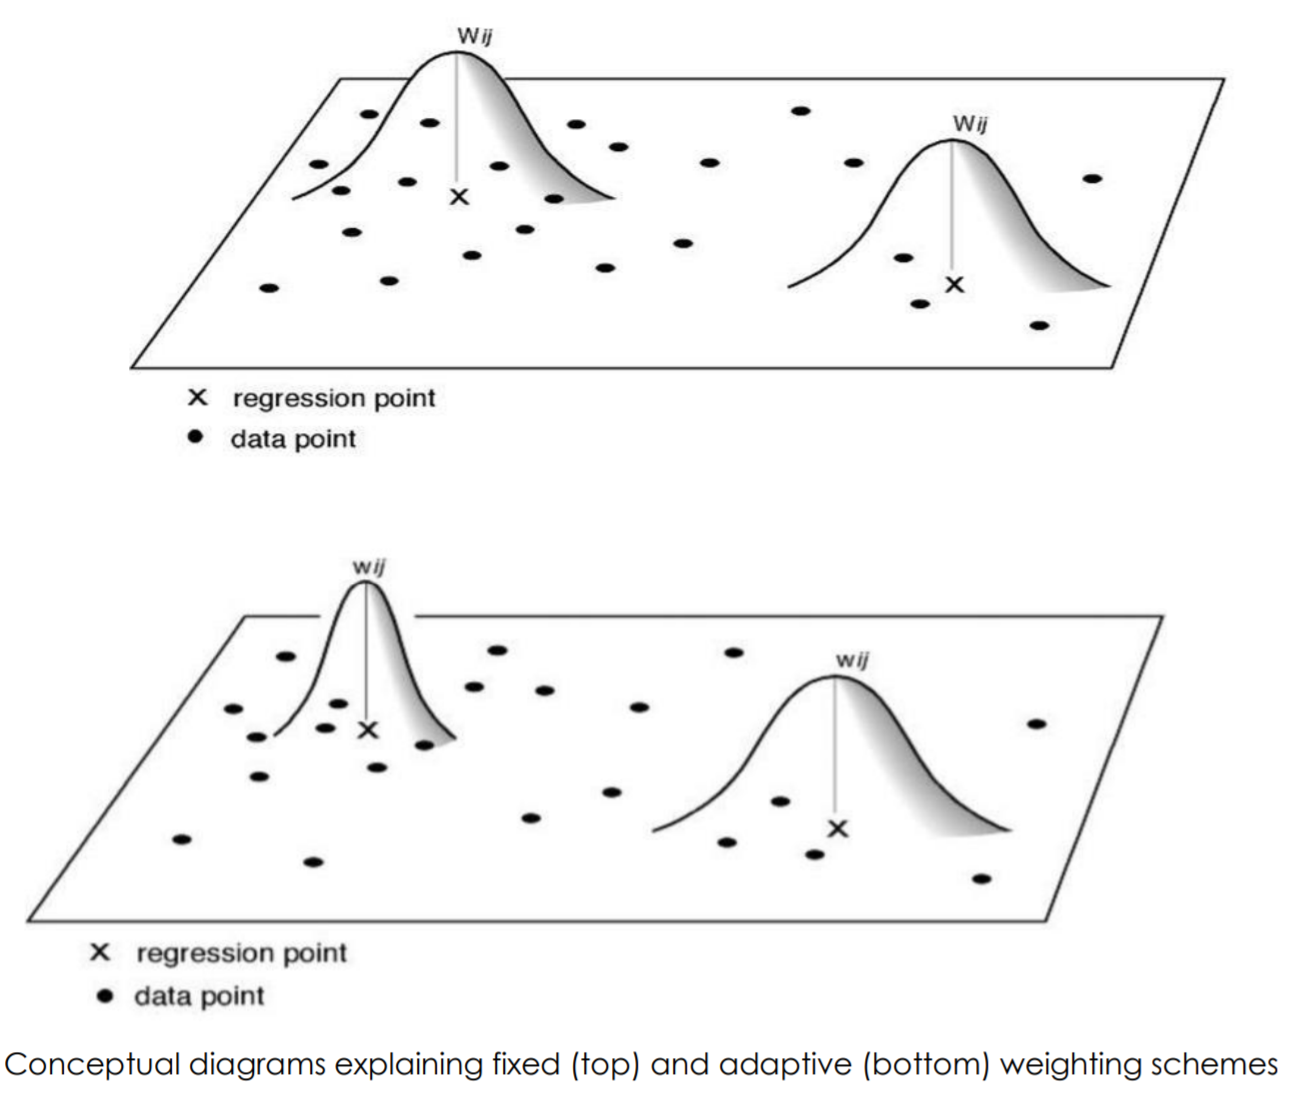
Spatial Weighting Kernels and other Options
Advanced options